Operational Reporting & Dashboards
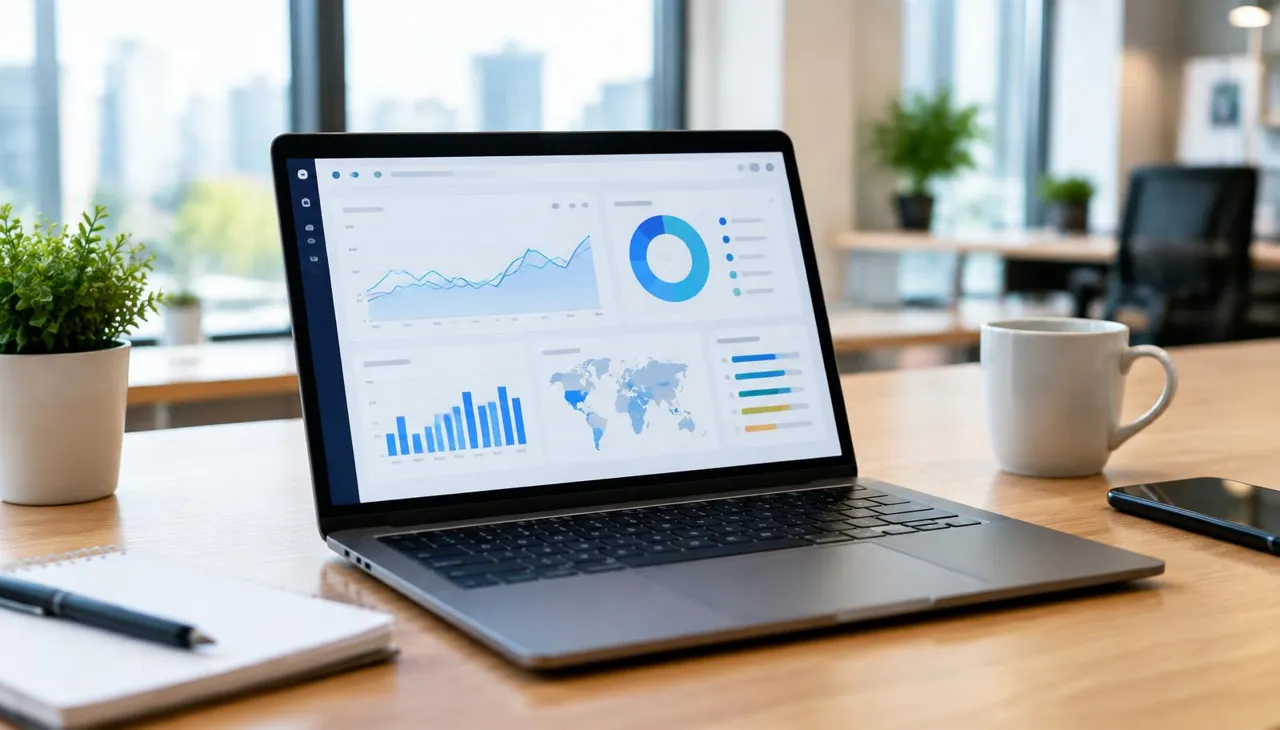
Custom dashboards that surface bottlenecks and KPIs automatically, so managers act on data instead of chasing it.
Leaders need answers, not spreadsheets. We build reporting that pulls from your operations automatically and highlights what needs attention today.
The problem
What breaks without it
Reports built by hand in spreadsheets
Problems spotted too late to fix cheaply
No single view across teams
How it works
How operational reporting & dashboards runs
- 01
Connect your tools
We link the systems you already use.
- 02
AI cleans and combines
Data is tidied and merged into one trusted source.
- 03
Dashboards update
Live views refresh automatically, no spreadsheets.
- 04
Alerts flag risks
You're notified the moment something needs attention.
- 05
Weekly summaries
A plain-language recap lands in your inbox.
See it in action
A dashboard built around your industry
Pick an industry to see the kind of numbers we put in front of managers. Every chart here uses sample data.

Schedule variance
Sample dataTrending in the right direction
Project risk score
Sample data
Key features
What's included
Live KPI dashboards
Key numbers update automatically from your systems.
Risk and bottleneck alerts
Flags jobs, teams or accounts that need attention before they slip.
Automated weekly summaries
A plain-language recap emailed to the right people every week.
Role-based views
Each person sees the numbers relevant to their role.
Custom metrics
Track the KPIs your business actually runs on.
Export
Download reports for meetings, clients or accountants.
Built for your industry
See it in your world

In Construction
Schedule variance and project risk are tracked live, with alerts for jobs slipping behind or heading over budget.
Explore ConstructionResults
What clients see
Less manual work, faster responses and a clearer view of the work, measured against your own starting point.
Integrations
Works with your tools
- Salesforce
HubSpot
Zapier
QuickBooks
Google Calendar
- Slack
Make
Airtable
n8n
Gmail
Stripe
- Microsoft Outlook
Plus hundreds more through direct connections and automation platforms.
FAQ
Common questions
Most systems that hold your jobs, leads and schedules can feed a dashboard. We'll map your data sources on a discovery call.
Related services
Pairs well with
Workflow Automation
Automate the handoffs between intake, estimating, scheduling, field teams and billing.
Learn moreField and Job-Site Tracking
Real-time visibility into where your crews, technicians, drivers and fleets are, and what is done.
Learn moreClient Communication
Automated updates, reminders and follow-ups that keep every client informed.
Learn moreReady to take the busywork out of operations?
Book a strategy call and we'll map the highest-impact AI workflows for your business — no fluff, just outcomes.